GANTT CHART
Brief description:
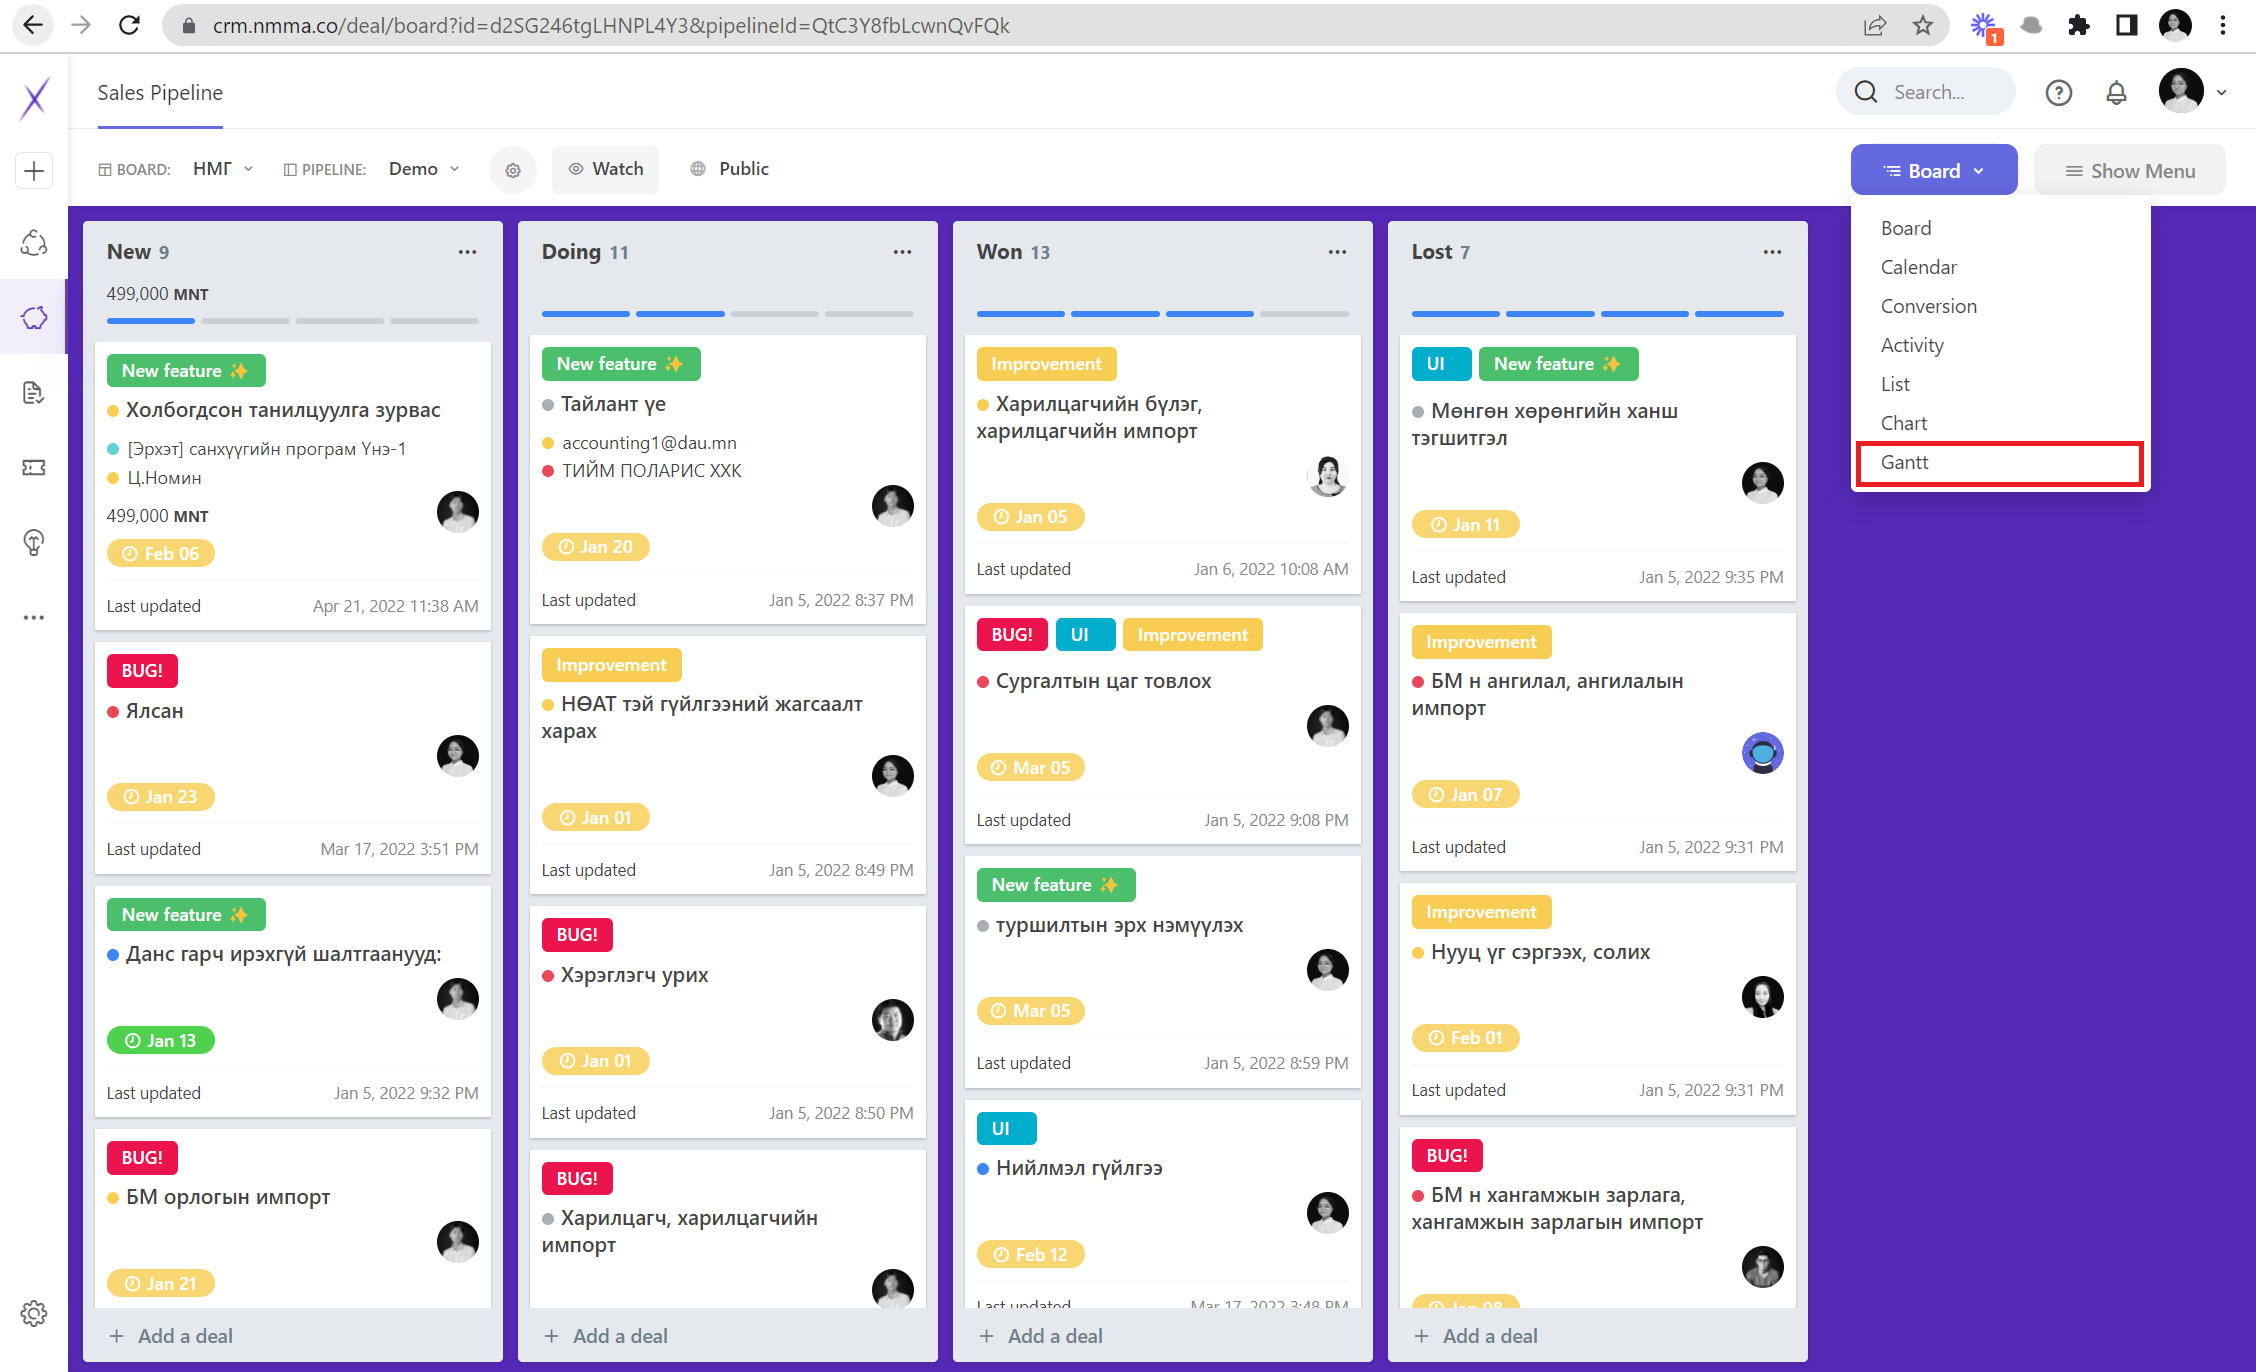
The Gantt chart is a section that allows you to view the details of a particular card in the sales, transaction, task, and ticket fields over time, and is a field view. The Gantt chart is designed to be a day-to-day area for monitoring the workload of the team members who lead the team.
How to use?
Prerequisites:
-
Start date
-
Close date
You can filter and classify your and your team's overall work in the field as follows. Group by:
Stage: Step by step
Label: Label
Priority: Significance
Assign: As a team member
What opportunities will it give you?
-
You see the work of each team member by time and workload.
-
For each task, see how many team members are working and how long it takes to complete.
-
Distinguish how much of a particular emergency or how much of an emergency is on schedule.
.gif)